Find Your California Representatives
Find Your Federal Representatives
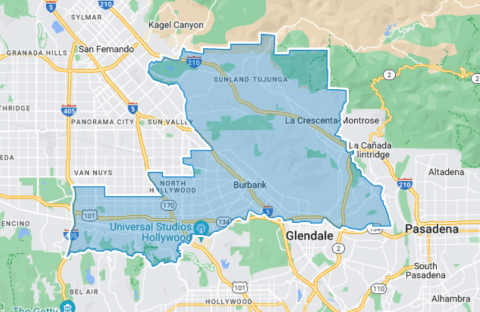
DISTRICT AD44
2020 Census Population (adj Elec. §21003)
| Name | Count | Percent |
|---|---|---|
| Total Population (POP) | 514,568 | 100.00% |
| POP Hispanic or Latino | 108,552 | 21.10% |
| POP Not Hispanic or Latino (NH) | 406,016 | 78.90% |
| POP NH Population of one race | 383,183 | 74.47% |
| POP NH White alone | 305,541 | 59.38% |
| POP NH Black or African American alone | 17,741 | 3.45% |
| POP NH Asian alone | 55,599 | 10.80% |
| POP NH American Indian and Alaska Native alone | 768 | 0.15% |
| POP NH Native Hawaiian and Other Pacific Islander alone | 431 | 0.08% |
| POP NH Some Other Race alone | 3,103 | 0.60% |
| POP NH Population of two or more races | 22,833 | 4.44% |
2020 Census Housing Occupancy Status
| Name | Count | Percent |
|---|---|---|
| Total Housing Units | 223,347 | 100.00% |
| Occupied | 213,556 | 95.62% |
| Vacant | 9,791 | 4.38% |
2020 Census Group Quarters Population (adj Elec. §21003)
| Name | Count | Percent |
|---|---|---|
| Total Group Quarters Population: | 4,235 | 100.00% |
| Institutionalized population: | 1,927 | 45.50% |
| Correctional facilities for adults | 22 | 0.52% |
| Juvenile facilities | 13 | 0.31% |
| Nursing facilities/Skilled-nursing facilities | 1,881 | 44.42% |
| Other institutional facilities | 11 | 0.26% |
| Noninstitutionalized population: | 2,308 | 54.50% |
| College/University student housing | 223 | 5.27% |
| Military quarters | 0 | 0.00% |
| Other noninstitutional facilities | 2,085 | 49.23% |
Counties In District
| Name | Count | Percent |
|---|---|---|
| Los Angeles | 514,571 | 5.12% |
Places In District
| Name | Count | Percent |
|---|---|---|
| LOS ANGELES: Burbank(C) | 107,614 | 100.00% |
| LOS ANGELES: Glendale(C) | 117,154 | 59.47% |
| LOS ANGELES: La Crescenta-Montrose(U) | 20,043 | 100.00% |
| LOS ANGELES: Los Angeles(C) | 269,760 | 6.90% |


